

ELK Biotechnology
SKU(재고 관리 코드):ELK3011
Human CFP(Complement Factor P) ELISA Kit
Human CFP(Complement Factor P) ELISA Kit
Human CFP(Complement Factor P) ELISA Kit
Overview
Standard curve
| Concentration (ng/mL) | OD | Corrected OD |
|---|---|---|
| 1000.00 | 1.898 | 1.794 |
| 500.00 | 1.621 | 1.517 |
| 250.00 | 1.124 | 1.020 |
| 125.00 | 0.871 | 0.767 |
| 62.50 | 0.536 | 0.432 |
| 31.25 | 0.352 | 0.248 |
| 15.63 | 0.258 | 0.154 |
| 0.00 | 0.104 | 0.000 |
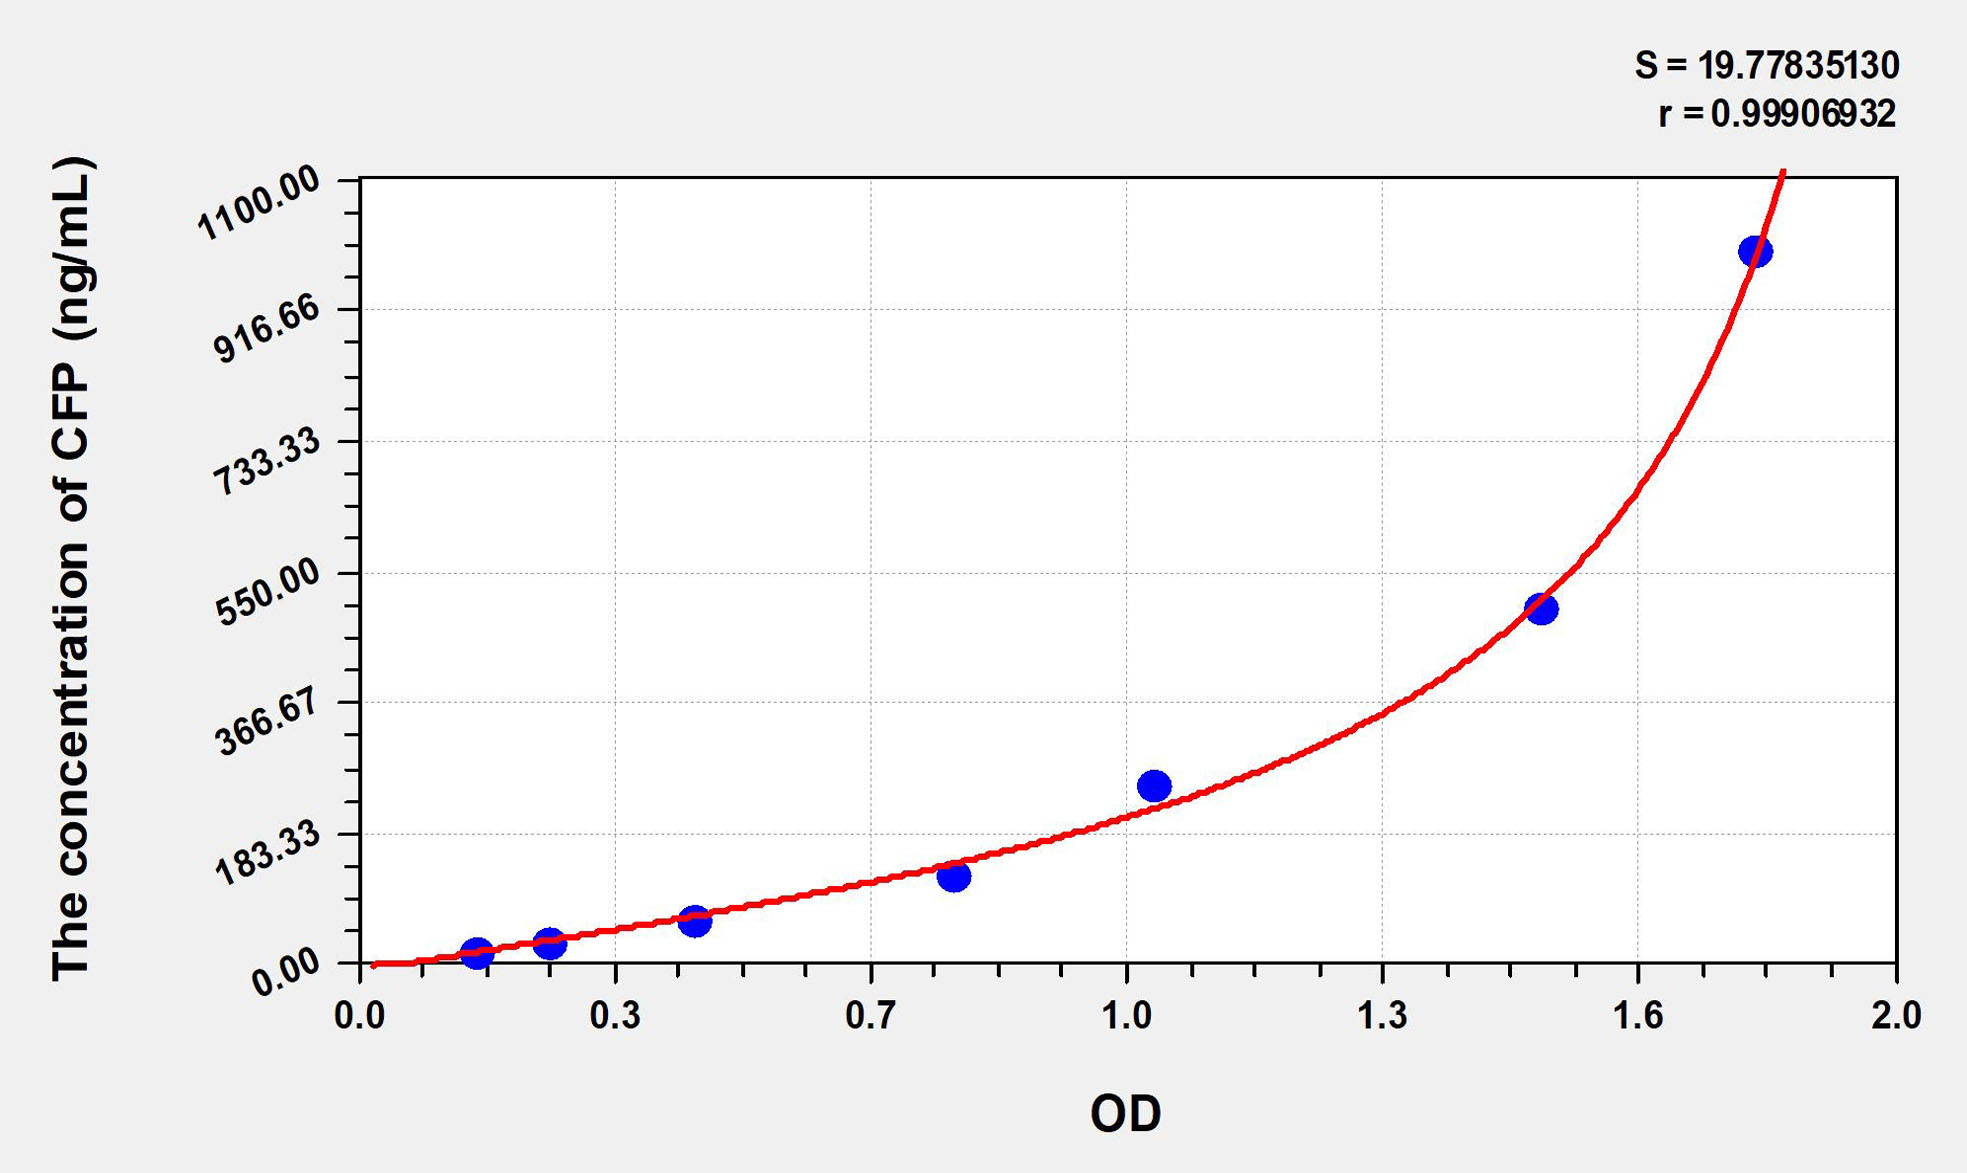
Precision
Intra-assay Precision (Precision within an assay):CV%<8%
Three samples of known concentration were tested twenty times on one plate to assess intra-assay precision.
Inter-assay Precision (Precision between assays):CV%<10%
Three samples of known concentration were tested in forty separate assays to assess inter-assay precision.
Recovery
Matrices listed below were spiked with certain level of recombinant CFP and the recovery rates were calculated by comparing the measured value to the expected amount of CFP in samples.
| Matrix | Recovery range | Average |
|---|---|---|
| serum(n=5) | 85-97% | 91% |
| EDTA plasma(n=5) | 78-93% | 85% |
| Heparin plasma(n=5) | 78-95% | 86% |
Linearity
The linearity of the kit was assayed by testing samples spiked with appropriate concentration of CFP and their serial dilutions. The results were demonstrated by the percentage of calculated concentration to the expected.
| Matrix | 1:2 | 1:4 | 1:8 | 1:16 |
|---|---|---|---|---|
| serum(n=5) | 78-95% | 96-103% | 83-101% | 82-97% |
| EDTA plasma(n=5) | 88-105% | 79-93% | 87-98% | 85-96% |
| Heparin plasma(n=5) | 86-95% | 82-93% | 97-106% | 89-102% |
