

ELK Biotechnology
SKU(재고 관리 코드):ELK8561
Human SP-D(Pulmonary surfactant-associated protein D) ELISA Kit
Human SP-D(Pulmonary surfactant-associated protein D) ELISA Kit
Human SP-D(Pulmonary surfactant-associated protein D) ELISA Kit
Overview
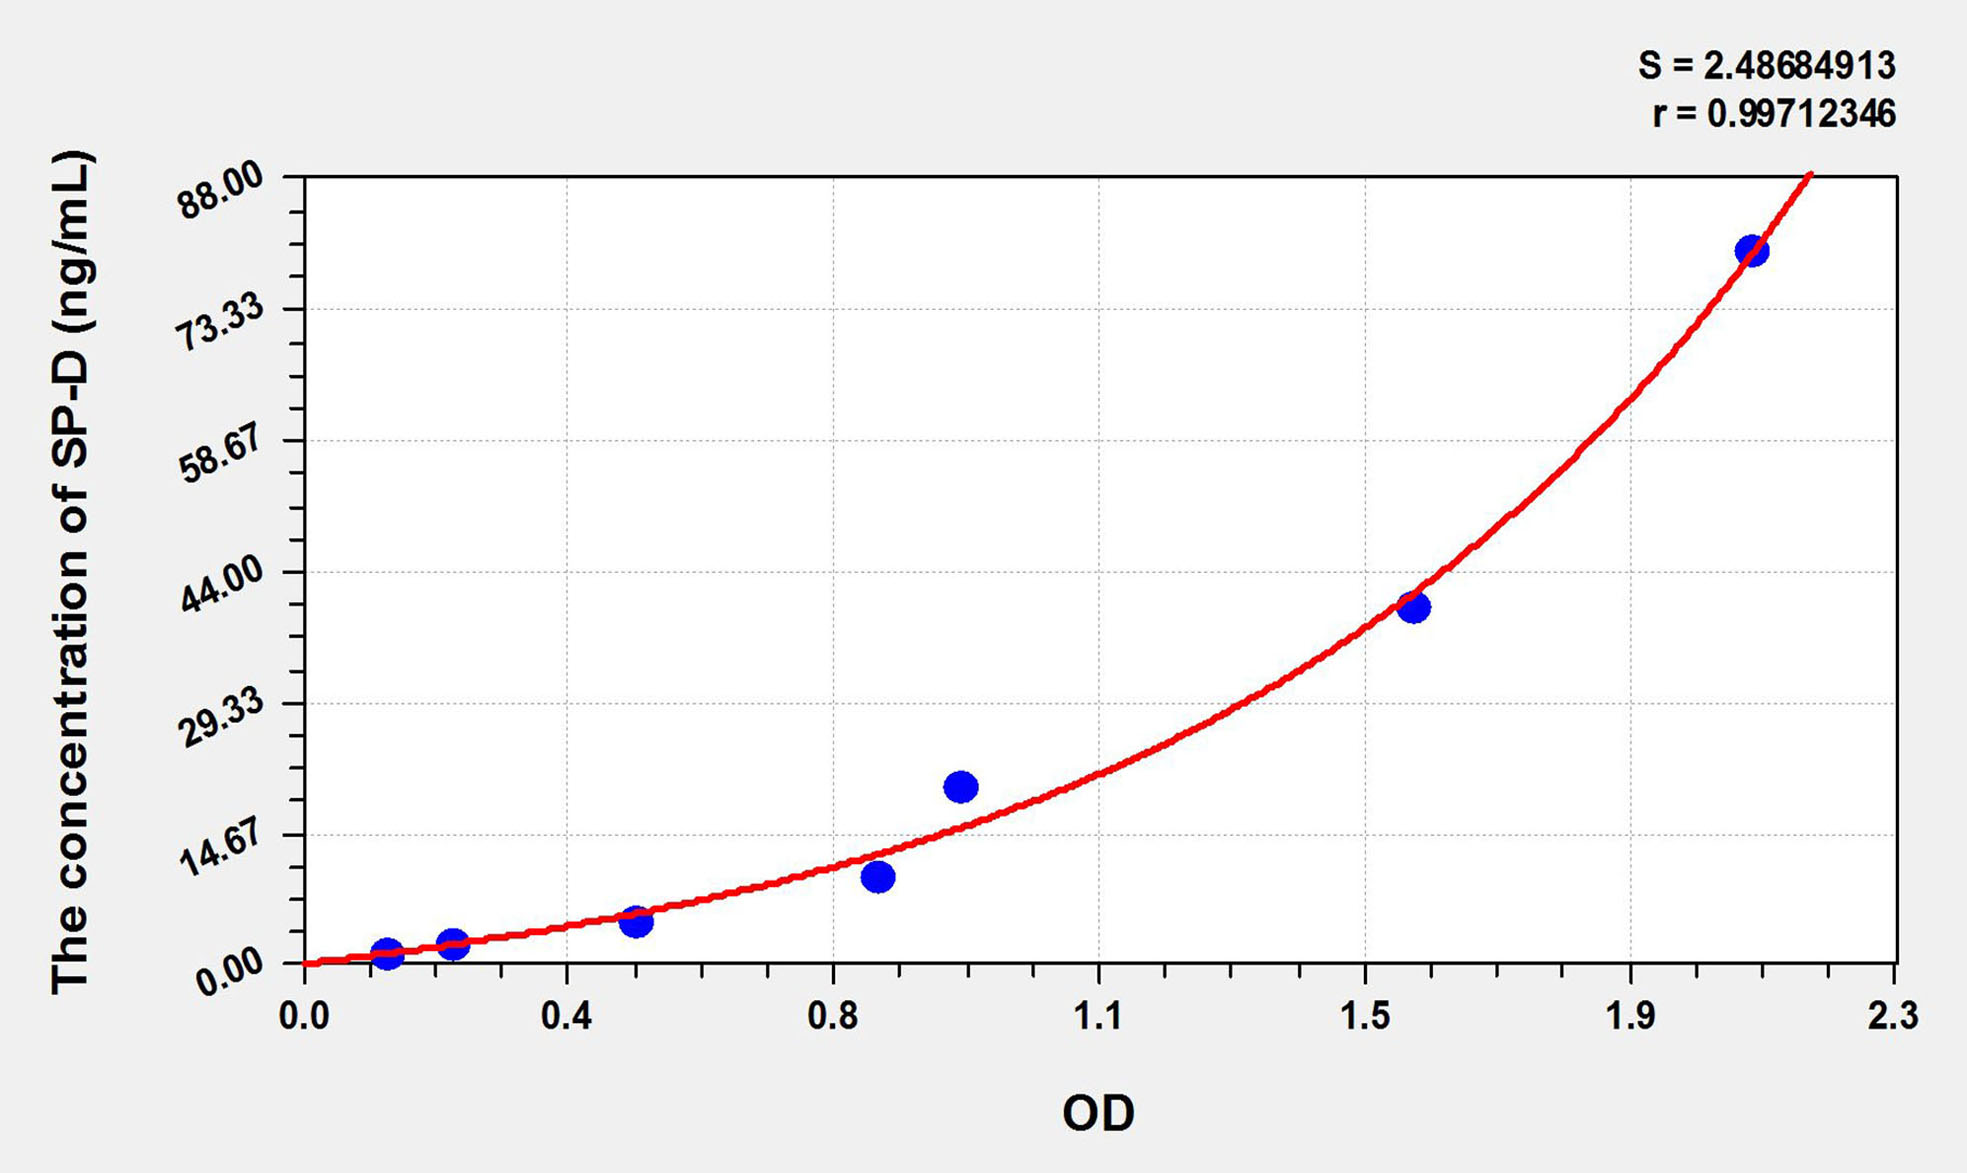
Standard curve
| Concentration (ng/mL) | OD | Corrected OD |
|---|---|---|
| 80.00 | 2.168 | 2.059 |
| 40.00 | 1.687 | 1.578 |
| 20.00 | 1.043 | 0.934 |
| 10.00 | 0.928 | 0.819 |
| 5.00 | 0.582 | 0.473 |
| 2.50 | 0.325 | 0.216 |
| 1.25 | 0.228 | 0.119 |
| 0.00 | 0.109 | 0.000 |
Precision
Intra-assay Precision (Precision within an assay):CV%<8%
Three samples of known concentration were tested twenty times on one plate to assess intra-assay precision.
Inter-assay Precision (Precision between assays):CV%<10%
Three samples of known concentration were tested in forty separate assays to assess inter-assay precision.
Recovery
Matrices listed below were spiked with certain level of recombinant SP-D and the recovery rates were calculated by comparing the measured value to the expected amount of SP-D in samples.
| Matrix | Recovery range | Average |
|---|---|---|
| serum(n=5) | 77-95% | 86% |
| EDTA plasma(n=5) | 88-103% | 95% |
| Heparin plasma(n=5) | 92-106% | 99% |
Linearity
The linearity of the kit was assayed by testing samples spiked with appropriate concentration of SP-D and their serial dilutions. The results were demonstrated by the percentage of calculated concentration to the expected.
| Matrix | 1:2 | 1:4 | 1:8 | 1:16 |
|---|---|---|---|---|
| serum(n=5) | 83-95% | 88-102% | 85-97% | 80-92% |
| EDTA plasma(n=5) | 85-96% | 87-101% | 89-102% | 85-98% |
| Heparin plasma(n=5) | 86-95% | 93-103% | 85-94% | 87-101% |